PLASMA
Princeton Locomotive And Shop MAnagement System
Winner, Best paper prize, Society for Transportation Science and Logistics, 2015

PLASMA is a planning system developed at CASTLE Laboratory at Princeton University for locomotive planning and management. The system has been primarily supported by Norfolk Southern, where it is currently used for strategic planning (fleet size and mix), and operational planning (including shop routing). PLASMA is based on the modeling and algorithmic technology of approximate dynamic programming, which can be viewed as a form of “optimizing simulator.” Rather than formulating the problem as a single, large (deterministic) optimization problem, PLASMA uses feedback learning to solve the problem as a sequence of smaller problems, closely mimicing how humans solve problems. It is a highly intuitive, yet mathematically rigorous, modeling and algorithmic strategy.
ADP technology allows PLASMA to capture a very high level of detail about locomotives, trains and operations. Each locomotive is modeled individually. It can handle shop routing, foreign power, requirement of specialized equipment and consist breakups. Arrivals and departures are modeled down to the minute. With these capabilities, we have been able to accurately calibrate the model against historical operating statistics at NS.
PLASMA can be run on deterministic data (which is how NS has used the system), but it also can model uncertainty in transit times, yard delays, train schedules, and equipment failures, creating robust policies that handle uncertainty well (see the Transportation Science article provided below)
PLASMA is the model engine within a larger information system called LARS developed at Norfolk Southern. LARS handles all of the information flows and displays required to run the model.
Myths about approximate dynamic programming
A partial list of features (designed primarily for NS, but some are motivated by a project with BNSF):
- Each locomotive is modeled individually, making it possible to handle virtually any detail (power, tractive effort, flush toilets, bullet-proof glass, communications equipment, direction on the track, ownership, current consist, estimated time of arrival, next shop appointment).
- PLASMA can model both horsepower and tractive effort on the controlling grade for each train. It can also handle requirements for specialized equipment.
- The model handles the cost of consist formation and breaking. The model will strike a balance between breaking consists and train delay. Consists will be broken if necessary, using a user-controlled penalty.
- The model will route power to shop, maximizing productivity while being moved to shop.
- PLASMA also models shop congestion, and will help to choose the right shop to strike a balance between shop appointments, productivity getting the power to shop and shop congestion.
- The model can plan “light engine moves” (moving power without a train), or it may reposition power on a train.
- The model will route foreign power to exchange points, but again will strike a balance between returning power to the owning railroad and retaining power if needed.
- The model will delay trains if insufficient power is available.
- Arrival and departure times of locomotives and trains are modeled down to the minute. A train might be delayed, for example, for 52 minutes to wait for a late-arriving inbound train, even if the inbound train is only providing a single locomotive.
- The strategic model will recommend the correct fleet size and mix given a projected train schedule. The user is allowed to vary the overall fleet size (letting the model choose the mix), or you may simulate a specified fleet size and mix.
- If desired, the model can capture uncertainty in transit times and yard delays, as well as other forms of uncertainty. PLASMA will create robust policies that handle uncertainty efficiently by holding power in yards where they provide the greatest value. These policies are adapted (by PLASMA) to reflect the degree of uncertainty, as well as the relative size of the fleet.
Technical paper (to appear in Transportation Science):
Belgacem Bouzaiene-Ayari, C. Cheng, S. Das, R. Fiorillo, W.B. Powell, “From Single Commodity to Multiattribute Models for Locomotive Optimization: A Comparison of Integer Programming and Approximate Dynamic Programming,” Transportation Science, Appeared online, August 4, 2014. http://dx.doi.org/10.1287/trsc.2014.0536 (c)Informs. This is an in-depth technical article that describes the mathematics and algorithm in considerable detail. Winner, TSL Best Paper Prize, 2015.
Non-technical summary (to appear in Interfaces):
W.B. Powell, B. Bouzaiene-Ayari, Clark Cheng, Sourav Das, Ricardo Fiorillo, Coleman Lawrence, “Locomotive Planning at Norfolk Southern: An Optimizing Simulator Using Approximate Dynamic Programming,” Interfaces, Vol. 44, No. 6, pp. 567-578., 2014. (c)Informs. This is an equation-free summary of the implementation of PLASMA at Norfolk Southern.
A powerpoint presentation on PLASMA:
PLASMA: Approximate Dynamic Programming for Locomotive Planning, June, 2012
It is important to plan the flows of locomotives over time. We have to make sure we reposition power to handle trains in the future, and we have to make sure that locomotives make it to shop appointments on time.
Even if we assume we know the future perfectly, solving the locomotive optimization problem over horizons of more than 3 days, capturing all the features above, proved to be well beyond the capability of modern solvers, even with access to parallel processing.
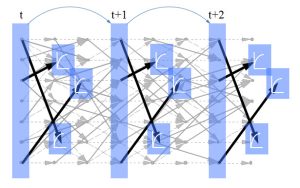
Approximate dynamic programming breaks a single large problem into a series of smaller problems as depicted to the right. Locomotives are assigned to a single train, using value functions to capture the value of power in the future. The value function approximations are estimated using feedback learning over the course of many simulations.
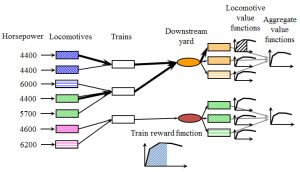
PLASMA uses a novel hierarchy of value functions to capture the value of individual types of locomotives, while also modeling the aggregate need for power in the future.
These problems can be solved exactly using Cplex in a few seconds. This made it possible to solve hundreds of these problems over time while adaptively learning the value function approximation.
PLASMA simulates this dispatch policy over time. This is then repeated 50 to 80 times to learn the value function approximations. As a result, PLASMA is able to simulate activities for days or even weeks into the future. For strategic planning, we typically run the model over a month. For operational planning, we typically simulate over a week.
As we simulate forward, we can use a single future, representing a deterministic model. Or, we can sample different realizations of train delays, yard delays, train tonnages, train schedules and equipment failures. The basic running of the model does not change between stochastic and deterministic versions.
When used as an operational planning system, each forward pass starts from a snapshot of all the locomotives which captures their current location, position within a consist, and maintenance status. When used as a strategic planning system, all locomotives start from a common system pool (we often refer to this as a “node in the sky”). The model determines the initial position of each locomotive.
Myths about approximate dynamic programming
We would like to put to rest two popular myths about approximate dynamic programming.
Myth 1: Approximate dynamic programming is for stochastic problems
We first began using ADP as a decomposition method to solve large deterministic problems in transportation. ADP breaks large fleet management problems into sequences of small assignment problems. This is how we can model each locomotive individually, with many attributes. The real power of ADP is its ability to handle a high level of detail At this time, Norfolk Southern is only using ADP for deterministic models.
Myth 2: Stochastic optimization problems are “hard” and “just for academics.”
As we show below, using ADP for stochastic versions of the locomotive problem is not only intuitively simple, it produces much more realistic results which more closely match what locomotive planners actually do. It is not rocket science to realize that you need to hold extra locomotives in a yard to deal with the potential of late arrivals, added trains or locomotive failures. What is hard is writing rules to manage these extra locomotives that adapt to time of day, day of week and situations around the railroad. PLASMA handles all of this using simple nonlinear functions that put more value on holding locomotives. Click here for a short summary of how PLASMA handles uncertainty.
The software architecture is designed so the model can be run in three different modes:
- Strategic planning – The model decides how many locomotives to use of each type, and also chooses the starting location, so that the system does not require a locomotive file with starting locations.
- Tactical planning – This version of the system requires a locomotive snapshot with starting locations. In a production setting, the tactical planning system is set up to run continuously during the day, updating each minute as changes are made in the train schedule or status of locomotives. The tactical system can help plan repositioning of power, as well as anticipate problems before they happen. The core engine is the same as that used for the strategic planning system.
- Real-time planning – The strategic and tactical planning system simulate decisions over time with adaptive, feedback learning. The real-time system would simply optimize decisions for “here and now.” The concept (not yet implemented) is that the real-time system would make recommendations, responding in real-time to user overrides.
The concept is that all three models are running on basically the same model. The strategic and tactical systems iteratively simulate the locomotive assignment problem shown above, adaptively learning the value function approximations. The real-time system only solves one locomotive assignment problem, corresponding to the “here and now” problem.
PLASMA is built around the DRMS modeling library which is designed to handle discrete resource allocation problems. The same library was used to solve the tactical car distribution problem at NS, and has been used in other transportation applications (click here for an application in truckload trucking). The goal is a streamlined software architecture that simplifies long-term software maintenance.
PLASMA is imbedded in an information system developed at NS for the project called LARS. LARS handles all aspects of information retrieval and display for the user. LARS is the “car” that makes the PLASMA “engine” useful.

Model calibration began with a careful analysis of individual assignments. Pilotview is a powerful diagnostic tool for discrete resource allocation problems. It is possible to see individual locomotive to train assignments, including the assignments we chose to make, the assignments we considered but did not choose, and the assignments which were ruled out as infeasible.
The user can drill down on specific locomotives, trains and assignments for more information to fully understand why an assignment was made.
A key feature of the ADP decomposition strategy is that the smaller subproblems are diagnosable – if we do not understand the solution, it is generally fairly easy to identify whether the problem is data, the model (how the problem is represented, including various costs), or the algorithm (an issue that largely disappeared when we made the switch to solving subproblems optimally rather than the heuristic used in the first version of the code).
Thousands of man-hours were devoted to calibrating the model. This involved cleaning the data by NS, tuning the model (a joint project between Princeton and NS), and refining the algorithm at Princeton.
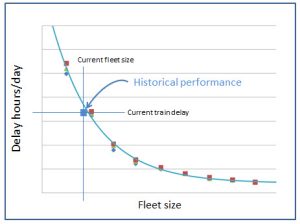
While the team looked carefully at detailed assignments and measured a variety of operational performance measures, the primary metric was total train delay as a function of fleet size. Getting train delay right required accurately modeling operations so that locomotive productivity was captured with a high level of precision.
The graph at the right shows train delay as a functio of fleet size. The square shows historical train delay at the correct fleet size. At the same time, it allows senior management to make judgments about the tradeoff between fleet size and train delay.
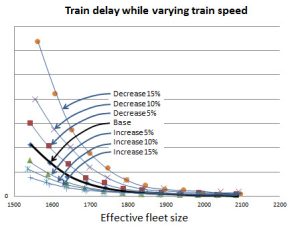
A study was undertaken to test the ability of the system to model the effect of train speed on the train delay curves. A real question is whether the model would respond in a stable, predictive manner.
A series of simulations were run for different fleet sizes while increasing or decreasing average train speeds by 5, 10 and 15 percent. The results, shown to the right, indicate that the response of the model is very stable.
Similar studies have been conducted to understand shop routing, the management of foreign power and the effect of consist breakup penalties. The model seems to respond in a stable way to sensitivity studies surrounding these parameters.
We ran experiments where we trained value functions first on deterministic travel times, and then using travel times sampled from probability distribution derived from history. The results are shown to the right for a particular yard, at a particular point in time.
The deterministically trained VFA rises and then levels off around 3-5 locomotives. The value of more than 3 locomotives at this yard is minimal.
When we model uncertainty, we show much higher values up to around 5 or 6 locomotives. This reflects the intuitive behavior that when a train might arrive late, then you need more locomotives at a yard.
Some what to our surprise when we developed this graph, the marginal value of locomotives is higher throughout the entire range. We believe this reflects the fact that under uncertainty, all locomotives are more valuable. Even if you do not need a locomotive now, you may need it later at the same yard, or at a downstream yard.
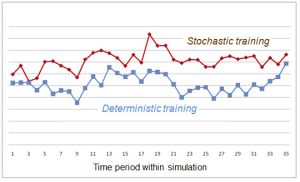
In simulations, if we are training under uncertainty, the model is more likely to hold onto power at a yard. However, the system will reposition power if another yard shows a higher marginal value. When VFAs are trained under uncertainty, the system is more likely to hold power, but adapts to the needs of the railroad. The graph to the right shows the inventories under stochastic and deterministic training over the course of a week. It shows that inventories are higher with stochastic training, as we would expect. But also notice that inventories are not the same over the week, reflecting the variation in demands on the fleet.
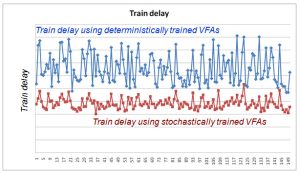
We compared the performance of stochastically and deterministically trained VFAs in a simulation which captured randomness in transit times. As we would expect, transit times are lower and more stable with the stochastically trained VFAs.

There has been a widespread misimpression that “stochastic models” are “complicated” and “academic.” We believe that the stochastically trained VFAs behave more like real railroads. Yard managers are known for wanting to hold onto power because of uncertainty. PLASMA has the same behavior when the VFAs are trained in the presence of uncertainty. The difference is that we hold onto power at the right time, and at the right locations. But instead of a fixed policy for holding onto power, we adapt as conditions warrant. If an inbound train is delayed, we release power in order to move trains on time. Instead of using hard rules on holding locomotive inventories, value function approximations can be thought of a soft rule.
The development effort behind PLASMA was started in 1996 with support from Norfolk Southern Railroad, and, starting in 1998, the Burlington Northern Sante Fe Railroad (the model at the time was dubbed “LRM” for locomotive routing model”). These railroads are quite different. NS is an eastern railroad with relatively short movements. BNSF is a western railroad with many trains that move from the midwest to the west coast, making numerous stops along the way which sometimes require adding or dropping power. The BNSF project focused more on shop routing, and while the project did not end in a successful implementation due to IT integration issues, the model developed some very sophisticated shop routing logic as a result.
The first attempt was successfully installed at NS in 2001 under the direction of Ajith Wijeratne, but the project was halted at the end of 2002 due to a lack of support from the business side. The project was restarted in 2005, divided into three stages:
- Strategic planning – This system is used to plan locomotive fleet size and mix, although the system can be used for a variety of strategic planning studies.
- Short-term operational planning – This is basically the same model as the strategic planning system, with the critical difference that it works from a snapshot giving the location and status of each locomotive. It also uses the live locomotive schedule. Planning is typically done over a week. The operational model is much more sensitive to errors in either the train plan or the locomotive snapshot.
- Real-time power assignment – The model is designed to also be used for real-time power assignment, although as of this writing this phase has not been started.
The first version of the model suffered from two algorithmic simplifications:
- A heuristic algorithm was used to optimize the assignment of locomotives to trains. This is a fairly hard integer programming problem with thousands of integer variables. A local search routine was developed which worked quite well most of the time. However, from time to time it would produce solutions that were incorrect. Since most “incorrect” solutions were due to data problems, algorithmic errors would sometimes require hours of debugging before we could eliminate data as the cause of the problem.
- We used value functions that were linear in the number of locomotives. This means that 4 four locomotives were always twice as valuable as 2 locomotives. This logic worked fairly well, but sometimes worked poorly and introduced significant instability.
During the delay from 2002-2005, the Princeton team replaced the heuristic logic with Cplex which had matured to the point where it could optimize locomotive to train assignments for the entire railroad in a few seconds. The real value of Cplex is not that it produces a better solution, but that it produces solutions that are more reliable. If we do not like a solution, it is not due to the algorithm.
The second major algorithmic change was the replacement of linear value function approximations with functions that were piecewise linear in the number of locomotives. We also use two sets of value functions: one for each type of locomotive at a yard, and a more aggregate one that includes all locomotives at a yard. This logic, which is much more difficult, produce solutions that were much more stable.
Finally, when the project was restarted, the NS team developed an entirely new information system called LARS to manage all the data flows.
The strategic planning system was put into production in 2008 and has earned the confidence of NS management.
The tactical system was put into production in 2010. Unlike the strategic planning system, the tactical system depends on an accurate snapshot of the status of each locomotive, and a good train plan (schedule of trains to move over the next week). The system highlighted issues with data quality that spawned a major re-engineering of the systems that support this data. This project is ongoing.
The project has benefitted from the contributions of a number of people over the years. The model was developed at Princeton University. Norfolk Southern provided the primary support for the project, although BNSF supported development of a version of the system duing the period 1998-2001. The participation of Brian Roth and Dave Ferguson at BNSF during this period is warmly acknowledged.
The system would never have been possible without a close working relationship between the model development team at Princeton, and a strong implementation team at the railroad to handle the interface with the information team and the business partners.
Princeton University
Professor Warren Powell – Project lead and architect of the ADP technology
Arun Marar – Arun was the first research staff member who developed the initial system that was implemented at NS between 1994 and 1996.
Belgacem Bouzaiene-Ayari – Belgacem replaced Arun in 1996, and over the years made many significant additions and modifications. Belgacem rewrote the fundamental modeling library, developed and calibrated the consist formation logic, shop routing logic, and the handling of foreign power. He handled the transition to the “nonlinear” logic and oversaw the implementation of the second version of the system over the 2005-2007 period. He logged thousands of hours with the NS team to work through data, modeling and algorithmic issues.
Norfolk Southern
The project was initiated by Roger Baugher, but the first version of the system, implemented over the 1996-2000 period, was managed by Dr. Ajith Wijeratne who also introduced the train delay curve which showed train delay as a function of fleet size. This curve is still being used to plan fleet size.
The team which handled the final implementation at NS included:
J. Coleman Lawrence – The locomotive manager during the final phase of the implementation. The project would not have happened without Coleman’s support.
Clark Cheng – Clark heads the operations research group at NS.
Ricardo Fiorillo – Project manager for the larger LARS project, in which PLASMA is imbedded.
Sourav Das – Project analyst
Junxia (Jane) Chang – Project analyst